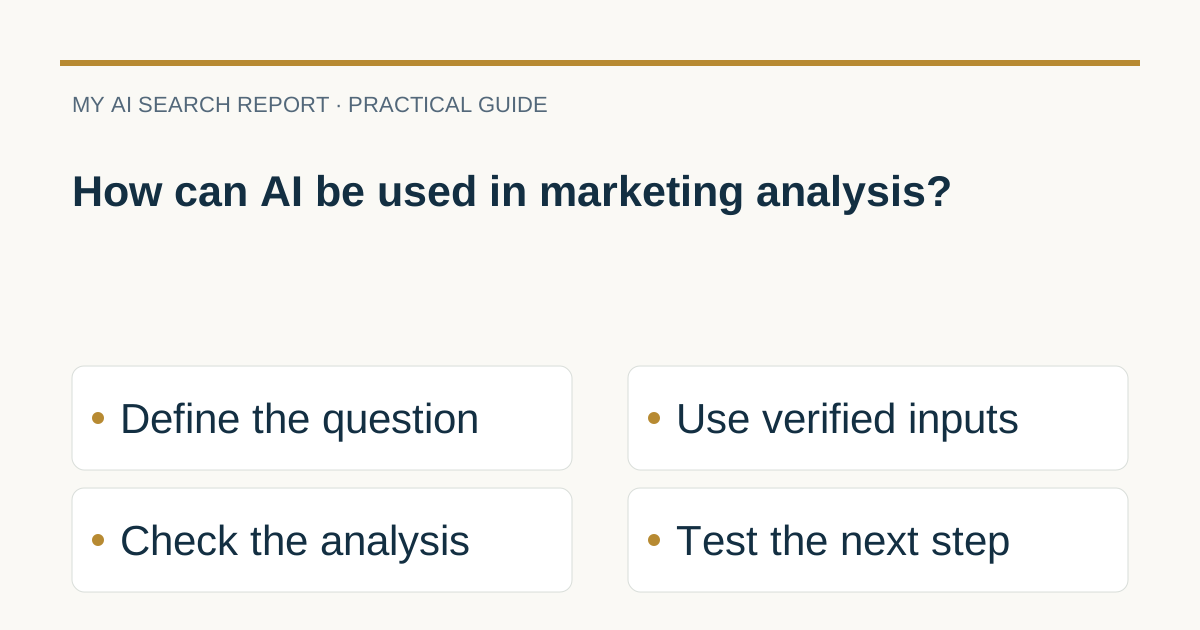
How can AI be used in marketing analysis?
Practical AI workflows for marketing analysis: clustering customer questions, categorising content, reading first‑party channel data, and turning patterns into testable hypotheses. Includes small sample inputs, verification steps, and measurement notes.
Workflow 1: Group customer questions into themes
Small illustrative input
Paste a small, de‑identified sample of recent support/email/chat questions (10-50 lines). Example:
1. Do you ship to Ireland and what’s the fee?
2. Why was a service fee added at checkout?
3. How do I exchange a size M for L?
4. Is there student pricing?
5. Can I schedule delivery for Saturday?
6. How do I cancel my subscription?
7. Do you have a trial period?
8. Your return label link is broken.
9. Do you support SSO for teams?
10. Is curbside pickup available?
Prompt and expected output
Ask the model to: “Cluster these questions into 5-8 themes with short labels and a few representative questions per theme. Return JSON with theme, rationale, and examples.”
{
  "themes": [
    {
      "name": "Shipping & delivery",
      "rationale": "Questions about destinations, timing, pickup.",
      "examples": [1, 5, 10]
    },
    {
      "name": "Fees & pricing",
      "rationale": "Checkout/service fees and discounts.",
      "examples": [2, 4]
    },
    {
      "name": "Returns & exchanges",
      "rationale": "Swaps and label issues.",
      "examples": [3, 8]
    },
    {
      "name": "Subscriptions & trials",
      "rationale": "Starting, canceling, and trial access.",
      "examples": [6, 7]
    },
    {
      "name": "Enterprise features",
      "rationale": "Organization-level sign-in.",
      "examples": [9]
    }
  ]
}
Verification steps
- Hold out 10-20% of questions. After clustering, check how well hold‑outs map to the themes.
- Spot‑check each theme’s examples. If labels feel vague, refine and rerun.
- Remember models can sound confident but be wrong; benchmarks of “deep research” systems still find factual accuracy is a key limitation, which is why human review matters (DRACO benchmark).
Workflow 2: Categorise content at scale
Small illustrative input
Provide a CSV with page URL, title, H1, and a short excerpt for 50-200 priority pages.
Prompt and expected output
Ask the model to classify each page by primary purpose (e.g., informational, navigational, transactional, support), topic cluster, and lifecycle stage, returning a table or JSON. Use the result to find gaps or duplicate intent coverage. Structured data on your pages can help search engines understand content meaning and may enable rich results, but it must reflect visible page content (Google: structured data).
Verification steps
- Review 20 randomly sampled rows against the actual pages.
- Flag ambiguous titles and add short summaries; reclassify only those rows.
- Log misclassifications and refine your taxonomy definitions before scaling to all pages.
Workflow 3: Interpret first‑party channel data
Small illustrative input
Export a week or month of channel metrics for descriptive analysis (sample values are hypothetical):
date,channel_grouping,sessions,cv_rate,avg_order_value
2026-10-01,organic_search,4200,2.8%,$92
2026-10-01,email,1600,4.9%,$88
2026-10-01,paid_search,3100,2.1%,$95
2026-10-01,referral,900,1.5%,$80
Prompts and expected outputs
- “Summarise channel mix for the period, call out channels above/below median conversion rate, and suggest 3 hypotheses to test.”
- “Create a short executive paragraph comparing CVR and AOV by channel; limit to 120 words.”
Use the outputs to prioritise follow‑up. Keep this descriptive: correlations and differences are not causal effects without proper experiments.
Verification and measurement
- Re‑compute key figures in your analytics UI or a spreadsheet. Note the report scope, sampling status, date range, and denominator used (e.g., sessions vs users).
- If you are tracking visits from AI surfaces, see our practical walkthrough on attribution configuration in GA4: How to see AI referral traffic in GA4?
- Google states that sites appearing in AI Overviews/AI Mode are counted within overall Search Console “Web” search traffic; analyse changes there alongside analytics (Google Search Central).
Workflow 4: Generate testable hypotheses
Turning patterns into tests
- From question clusters: “Service fee confusion” emerges. Hypothesis: a brief, inline fee explainer on cart reduces exits from checkout step 1.
- From content tags: many “returns policy” pages rank but few answer label issues. Hypothesis: a single canonical page with a clear label‑reprint flow reduces support tickets tagged “return label.”
- From channel data: email CVR is consistently above median. Hypothesis: replicating email’s value props on landing pages improves paid search CVR.
How to validate
- Define success metrics and guardrails upfront (e.g., CVR uplift with no AOV decline). Use A/B tests or controlled rollouts; avoid claiming lift from model summaries alone.
- Document assumptions, dates, audiences, and which pages or campaigns were in scope so results are reproducible.
Trust, citations and data handling
- Prefer tools that show source links so you can audit claims. Some AI research tools synthesise results from diverse sources and include direct citations, which helps verification (Perplexity: Pro Search). Still, open and read primary sources.
- Model answers can be eloquent but wrong; build a habit of checking a sample of outputs against originals (DRACO benchmark).
- Do not paste sensitive or customer‑identifying data into third‑party tools. Use de‑identified samples and review your vendor’s data‑use terms. Website owners can also control crawling by some AI training bots (for example, disallowing GPTBot via robots.txt) (OpenAI Help Center).
- When AI cites sources, assess whether those citations actually support the claim. Our explainer covers common failure modes: How accurate are AI citations?
Compact checklist
- Start with de‑identified samples; keep full datasets in your own BI stack.
- Use AI for descriptive tasks first: clustering, tagging, summaries.
- Ask for structured outputs (JSON/CSV) and short rationales.
- Always verify: hold‑out checks, spot‑reads, recalculated metrics.
- Translate patterns into one hypothesis per test; measure with first‑party analytics.
- Track scope, sampling, dates, and denominators in every report.
- Attribute traffic changes using Search Console and analytics; don’t replace measurements with model estimates (Google Search Central).
Quick FAQs
Can I upload raw customer chats?
Don’t. Remove or mask personal data and sensitive details before using external tools. Public web content may be used to train models, and site owners can opt control certain crawlers via robots.txt (OpenAI Help Center).
Does structured data help this work?
Structured data helps search engines understand your page content and can enable rich results when it matches visible content (Google: structured data), which supports clearer categorisation and analysis.
Put this into practice
Define one marketing decision, the source data and the check on the result before selecting a model. Preserve a human-readable evidence trail so a persuasive summary cannot silently replace missing or incompatible measurements.
If the input data comes from a website campaign, Orvus explains GTM and UTM. Confirm what each measurement represents before combining it in an analysis. GTM and UTM: the difference in marketing analytics.
Sources and further reading
- Google Search Central: AI features and your website
- Google: Introduction to structured data
- Perplexity Help: What is Pro Search?
- DRACO benchmark (Perplexity): Deep research accuracy, completeness, objectivity
- OpenAI Help Center: How ChatGPT and our foundation models are developed
Provider documentation can change. Check the current guidance before changing crawler or search settings.